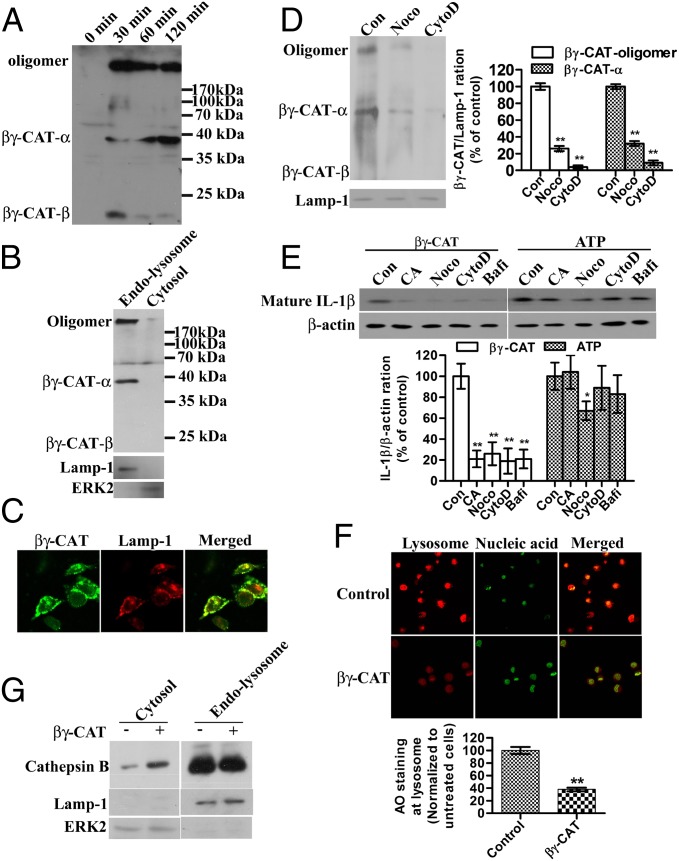
Fig. 4.
βγ-CAT endocytosis and lysosome destabilization induce IL-1β secretion. (A) Frog peritoneal cells were treated with βγ-CAT (100 nM) for 30 min to 2 h. The cells were then lysed for Western blotting detection of βγ-CAT. (B) Frog peritoneal cells were treated with βγ-CAT (100 nM) for 30 min and then lysed. The cytosolic fraction and endolysosomal fraction were prepared, and the distribution of βγ-CAT was assessed by Western blotting. Lamp-1 was used as the marker of the endolysosomal fraction, and ERK2 was used as the marker of the cytosolic fraction. (C) Mouse BMDMs were treated with βγ-CAT (5 nM) for 30 min and then stained with an anti–βγ-CAT antibody (green) and an anti–Lamp-1 antibody (lysosome marker) (red). βγ-CAT was colocalized with Lamp-1. (D) Frog peritoneal cells were pretreated with cytochalasin D (CytoD, 2 μM) or nocodazole (Noco, 10 μM) for 30 min before incubated with βγ-CAT (100 nM) for 30 min and then lysed. The endolysosomal fraction was prepared. βγ-CAT was assessed by Western blotting. βγ-CAT transported to endolysosomal fraction was quantified with ImageJ. (E) Frog peritoneal cells were pretreated with CA074-Me (CA, 30 μM), cytochalasin D (CytoD, 2 μM), nocodazole (Noco, 10 μM), or bafilomycin A1 (Bafi, 25 nM) for 30 min and then incubated with βγ-CAT (100 nM) or ATP (5 mM) for 2 h. The IL-1β concentration in the supernatants was assessed by Western blotting for B. maxima IL-1β. Cells were lysed for Western blotting detection of β−actin, serving as a loading control. Bands were semiquantified with ImageJ. (F) βγ-CAT–treated (100 nM for 30 min) or untreated frog peritoneal cells were stained with acridine orange (AO), and intact lysosomes were visualized using a Zeiss LSM510 microscope (red). The fluorescence intensity of the acidic compartment was quantified using ImageJ software. (G) βγ-CAT–treated (100 nM for 30 min) or untreated frog peritoneal cells were lysed, and the cytosolic and endolysosomal fractions were prepared. The leakage of cathepsin B from the lysosome into the cytosol was then assessed by Western blotting for cathepsin B. The data in D, E, and F represent the mean ± SD of triplicate samples. *P < 0.05 and **P < 0.01 by Student t test. The other data are representative of at least two independent experiments. See also Fig. S4.

