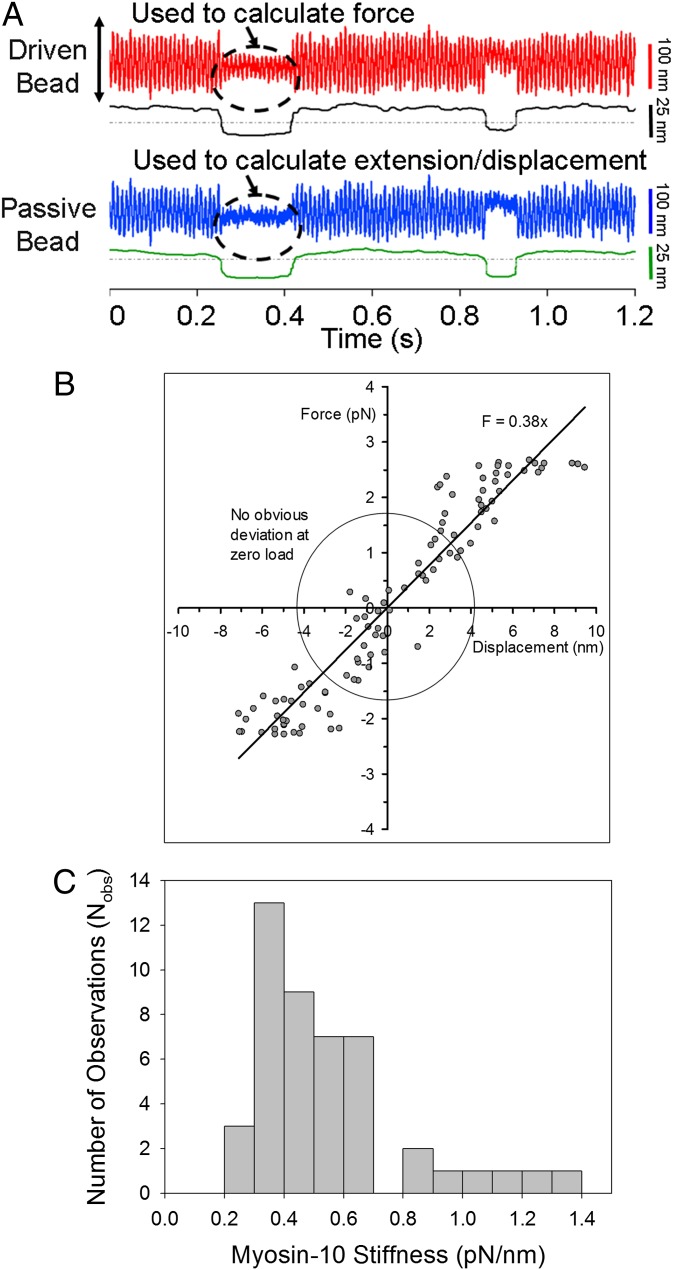
Fig. 5.
Single molecule acto-M10HMM stiffness. (A) Raw data for stiffness measurement of M10HMM using the three-bead assay. In each trace (driven and passive bead traces), top signal shows the raw data (red and blue) and the bottom signal (black) is variance. (B) Example force-displacement diagram of acto-M10HMM. The slope determines the stiffness of a single M10HMM bound to F-actin, which is ∼0.38 pN/nm, for this example. Within the circle (force ∼ ±1.5 pN and displacement ∼ ±4 nm), there seems to be no obvious nonlinearity behavior. (C) Distribution of acto-M10HMM stiffnesses spans from 0.2 to 1.5 pN/nm, with a median ∼0.45 pN/nm (Nmolecules = 59).

