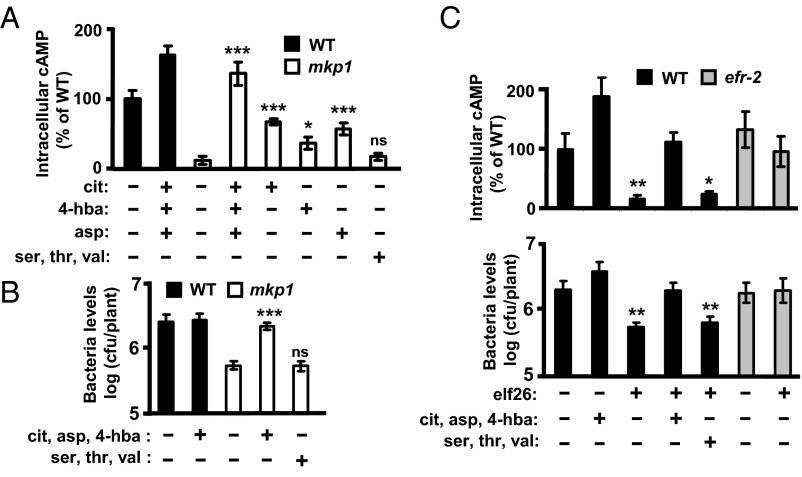
Fig. 4.
T3SS-inducing metabolites suppress both mkp1- and elf26-mediated inhibition of type III effector delivery. (A) WT and mkp1 plants were infected with DC3000 expressing AvrPto-CyaA as in Fig. 1 in the presence or absence of 50 μM each of citric acid (cit), aspartic acid (asp), and/or 4-hydroxybenzoic acid (4-hba) or with a non–T3SS-inducing mixture of 50 μM each of serine (ser), threonine (thr), and valine (val). Graphed data are means ± SE of cAMP levels 4 h postinfection; n = 8. (B) WT and mkp1 plants were infected with DC3000 in the presence or absence of the indicated metabolites at concentrations of 100 μM each. Graphed data are means ± SE of bacteria 24 h postinfection; n = 12. (C) WT and efr-2 plants were treated with 1 μM elf26 or a mock control for 24 h. (Upper) WT or elf26-treated plants were infected as described in Fig. 1 in the presence or absence of 50 μM of each of the indicated metabolites. cAMP levels were measured 4 h postinfection. Graphed data are means ± SE of percent cAMP relative to cAMP in infected WT plants; n = 8. (Lower) WT or elf26-treated plants were infected with DC3000 for 30 h in the presence or absence of 100 μM of each of the indicated metabolites. Graphed data are means ± SE of bacteria; n = 12. Asterisks denote t test comparison with mock-treated mkp1 in A and B, and with mock-treated WT in C; *P < 0.05, **P < 0.01, *** P < 0.001. ns, not significant.

