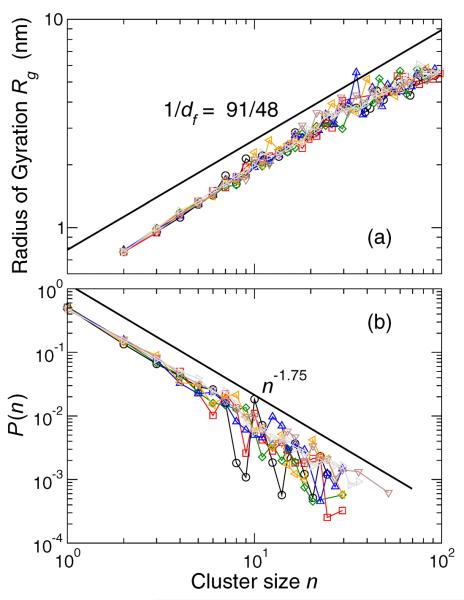
FIG. 12.
(a) Mobile lipid radius of gyration Rg as a function of cluster size, which determines the fractal dimension df. Different data sets are different T . For 2D percolation clusters near the percolation threshold, df = 91/48 [52], indicated by the bold line. Clusters are examined for all T in the Lo phase at interval t*. (b) The distribution of cluster sizes of mobile lipids. The functional from of P(n) comes from percolation theory [52].

