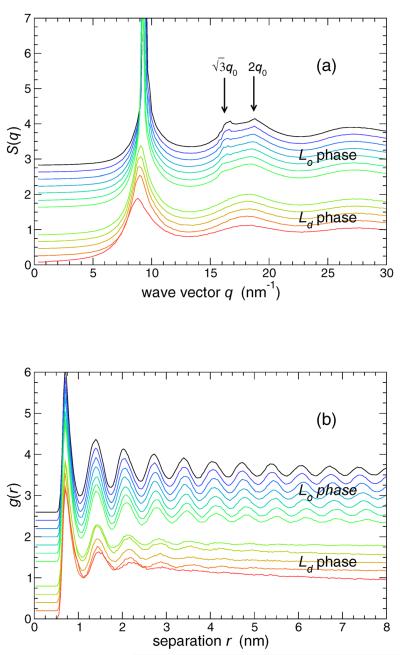
FIG. 3.
The in-plane structure of the lipid heads, quantified by (a) the structure factor S(q) and (b) radial distribution function g(r). The hexatic ordering of the lipids in the Lo phase is characterized by secondary features in S(q) indicated by the arrows. Similarly, the order is also reflected in the persistent oscillations of g(r). For reference to later figures, note that first neighbors can be defined as those beads with a separation less than the first minimum of g(r), which occurs at r ≈ 1.05 nm. Curves are shifted vertically for clarity of the figure: lowest T is at the top, highest T is at the bottom. A larger gap is left between data for the Lo and Ld phases.

