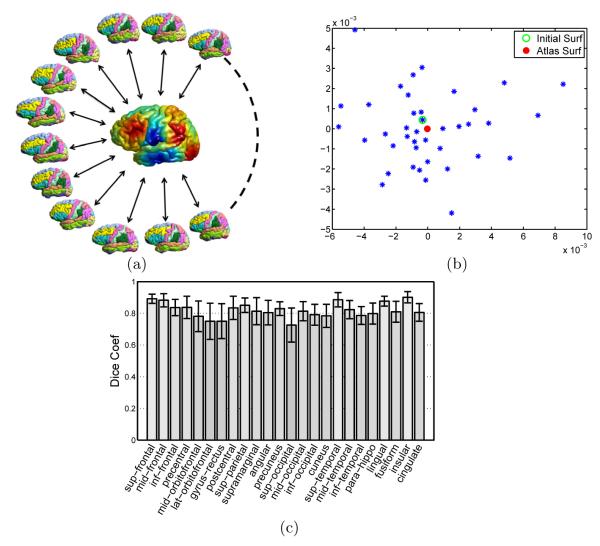
Fig. 5.
Multi-atlas fusion for cortical labeling. (a) All labeled surfaces are mapped to the embedding space with metric optimization to match the group-wise atlas shown in the center. (b) A multi-dimensional scaling (MDS) illustration of the surfaces and their group-wise atlas surface. (c) Bar plots of Dice coefficients of the 24 gyral regions in leave-one-out cross-validation.

