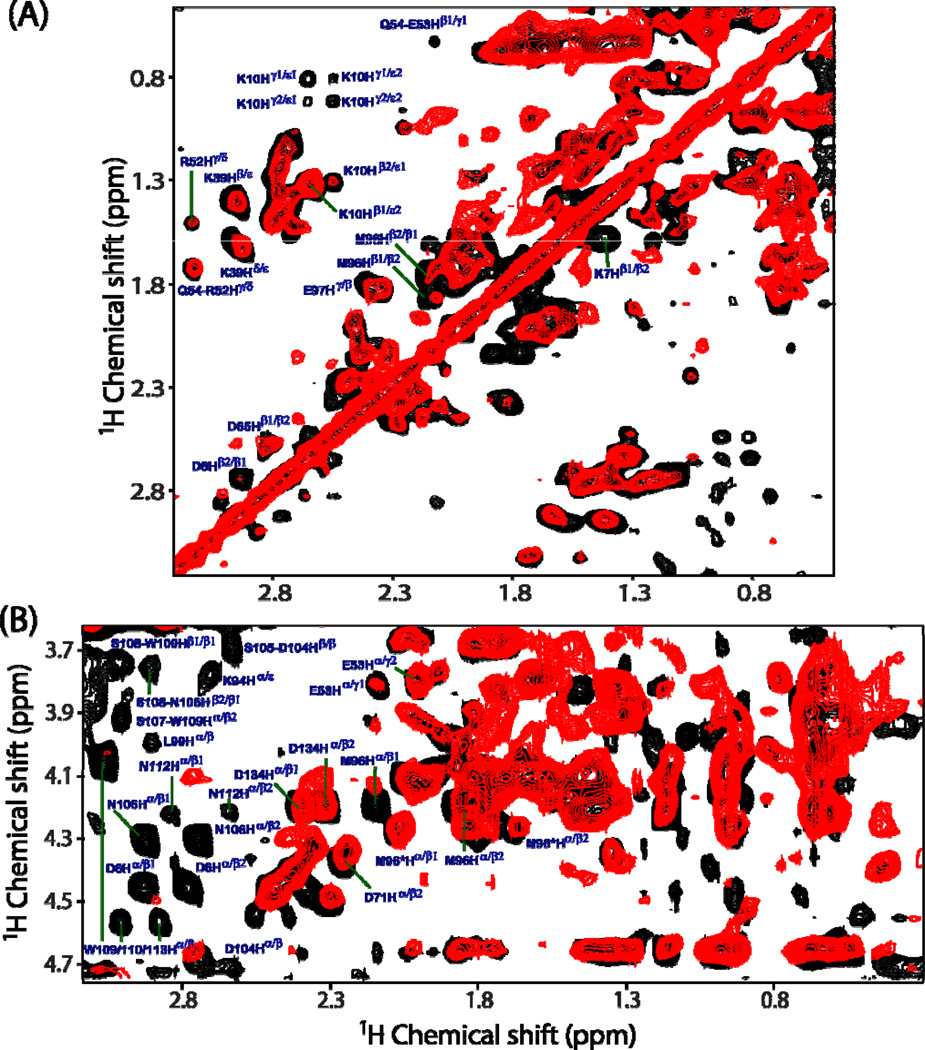
Figure 4.
Representative regions of 2D 1H-1H RFDR (black) and NOESY (red) spectra of cytb5 incorporated in perdeuterated DPC micelles showing the chemical shift correlations for 1Hβ-side chain protons (panel A) and 1Hα-side chain protons (panel B). RFDR and NOESY spectra were recorded at a mixing time of 50 and 200 ms, respectively, under 2.7 kHz MAS condition. Many additional cross-peaks are observed in the RFDR spectrum, which mostly belong to the side chains of the residues located in the transmembrane region of cytb5.

