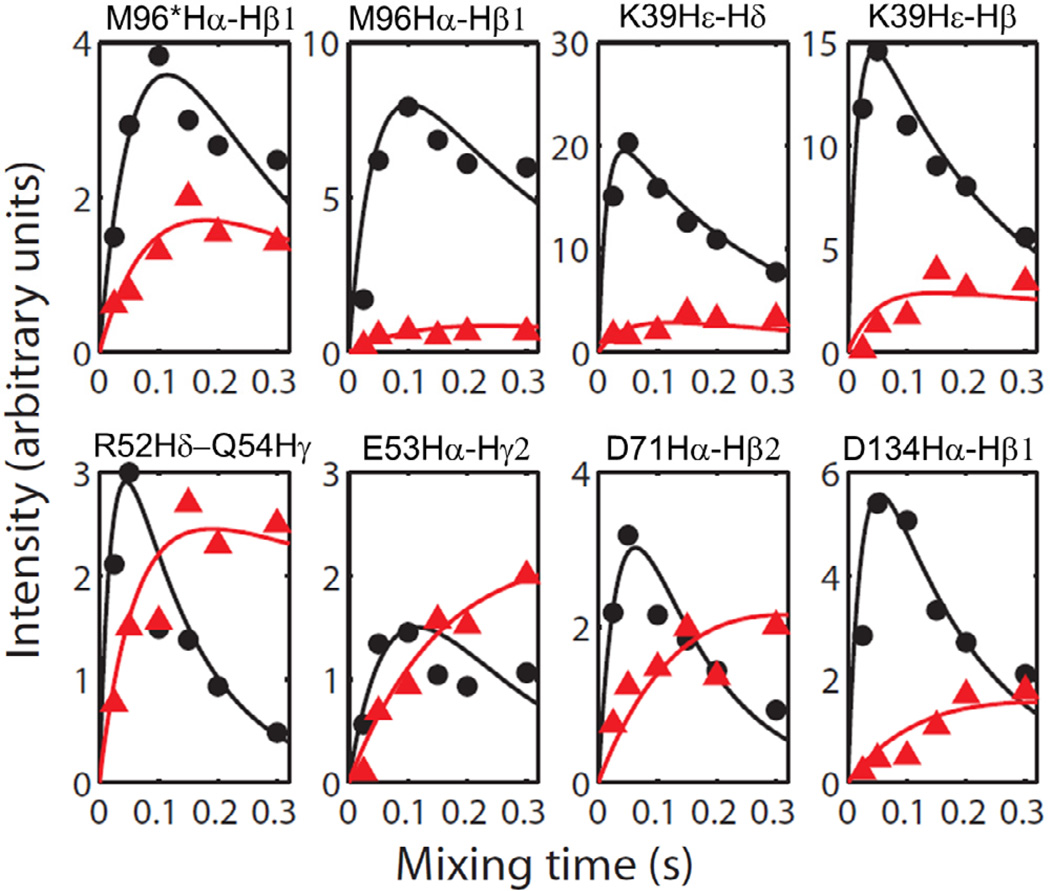
Figure 5.
The simulated buildup curves for various cross-peaks observed in Hα and side chain regions for selected residues of cytb5 obtained from the RFDR (Black) and NOESY (Red) experiments on cytb5 incorporated in perdeuterated DPC micelles. Though the intensity scale was arbitrarily chosen, the intensities of data points in all panels are directly comparable. RFDR and NOESY spectra were collected for six different mixing times, 25, 50 100, 150, 200 and 300 ms.

