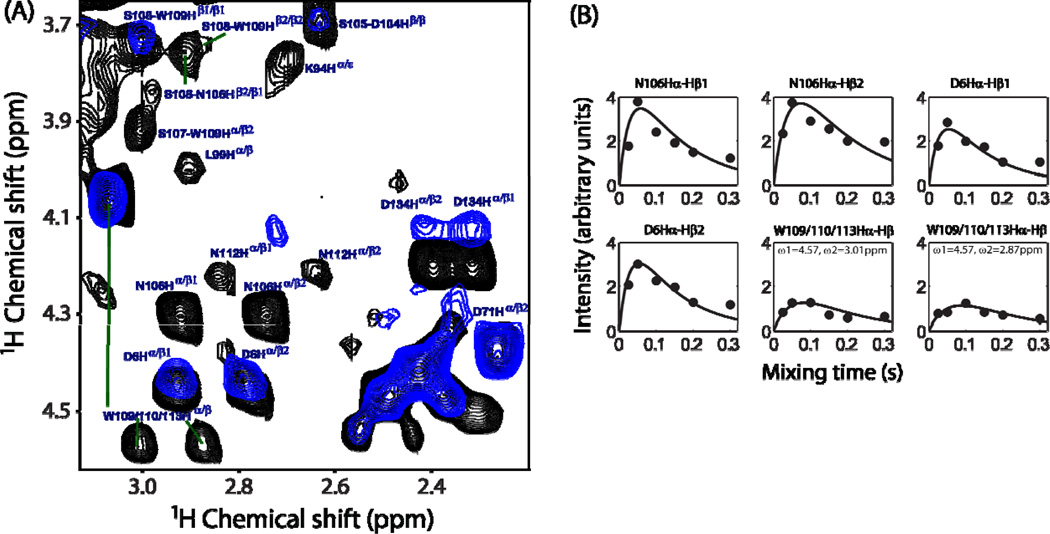
Figure 6.
(A) Superimposed 2D 1H-1H RFDR spectra of cytb5 in the presence (black) and absence (blue) of DPC micelles recorded at a mixing time of 50 ms. (B) Simulated buildup curves for the RFDR cross-peak intensities measured from the side chain resonances of residues in the transmembrane region of cytb5 in the presence of DPC micelles. All other experimental details are as given in Figure 5 caption.

