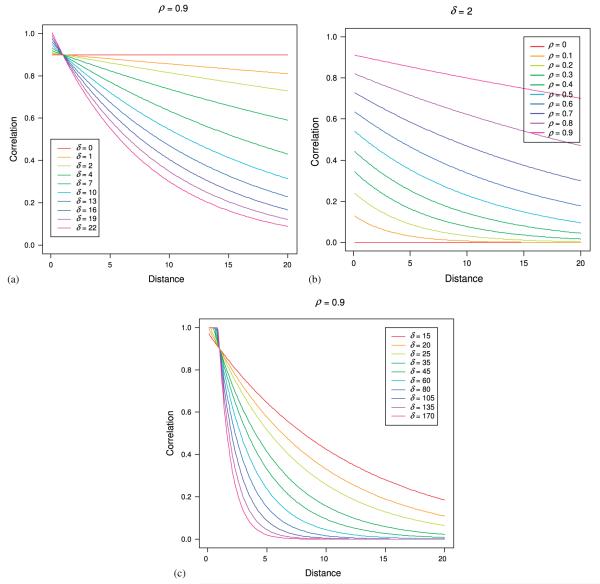
Figure 1.
(a) Plot of the various correlation patterns that can be obtained by varying the parameter δ while keeping ρ constant. δ = 19 corresponds to an AR(1) decay rate, whereas δ = 0 corresponds to compound symmetry; (b) Plot of the various correlation patterns that can be obtained by varying the parameter ρ while keeping δ constant; and (c) Plot of the various correlation patterns that can be obtained with larger values of δ while keeping ρ constant. Again δ = 19 corresponds to an AR(1) decay rate.

