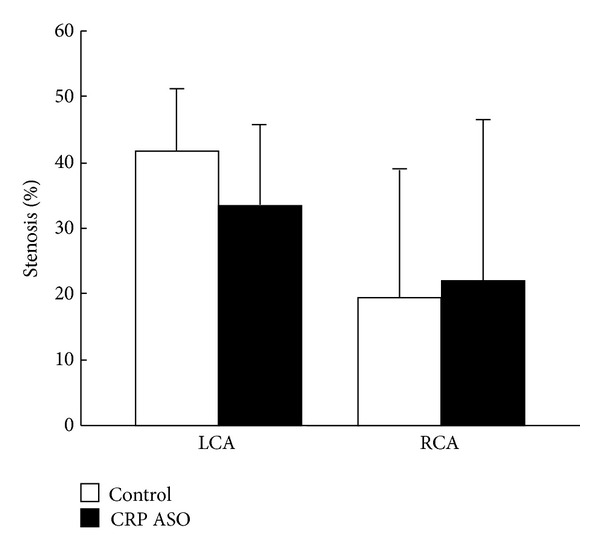
Figure 10.

Analysis of coronary atherosclerosis. The heart was cut into 7 blocks, and blocks I and II containing left and right coronary trunks were sectioned in 500 μm intervals (3 sections from each block) and stained with EVG. Coronary stenosis (lesion area/total lumen area × 100(%) was measured and is expressed as percentage. LCA indicates left coronary artery trunks; and RCA, right coronary artery trunks.
