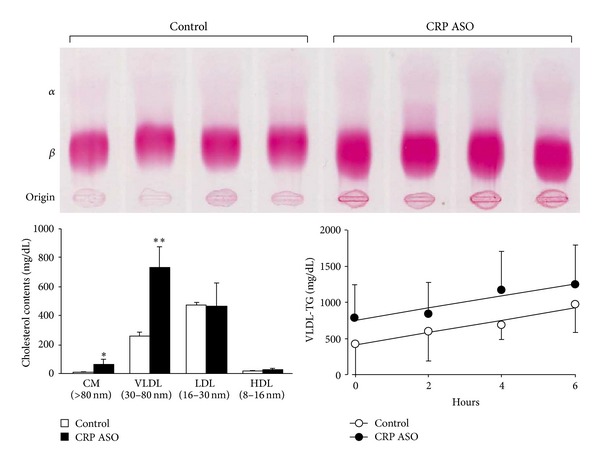
Figure 3.

Analysis of lipoprotein profiles. Lipoprotein profiles were analyzed by agarose gel electrophoresis (top) and HPLC (bottom left). Post-Triton VLDL production rate in fasting rabbits was measured. Blood was drawn at 0 minutes (before administration of Triton WR-1339) and 2, 4, and 6 hours after Triton WR-1339 injection. VLDL-TG (d < 1.006 g/mL) contents were quantified (bottom right). ASO-treated rabbits showed increased levels of β-migrating particles (both VLDL and chylomicron remnants) at the origin. VLDL synthesis rate (expressed by the slope of each line) was the same in ASO-treated rabbits as in the control. Data are expressed as the mean ± SD * or **P < 0.05 or 0.01 versus control. n = 4-5 for each group.
