Figure 7.

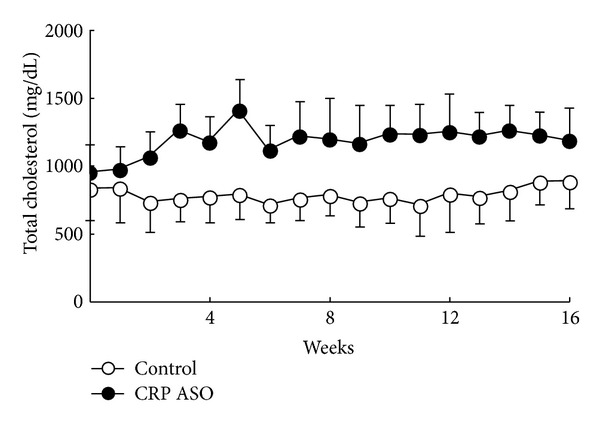
Plasma levels of total cholesterol. Data are combined from male and female rabbits and expressed as the mean ± SD. n = 10 for each group.

Plasma levels of total cholesterol. Data are combined from male and female rabbits and expressed as the mean ± SD. n = 10 for each group.