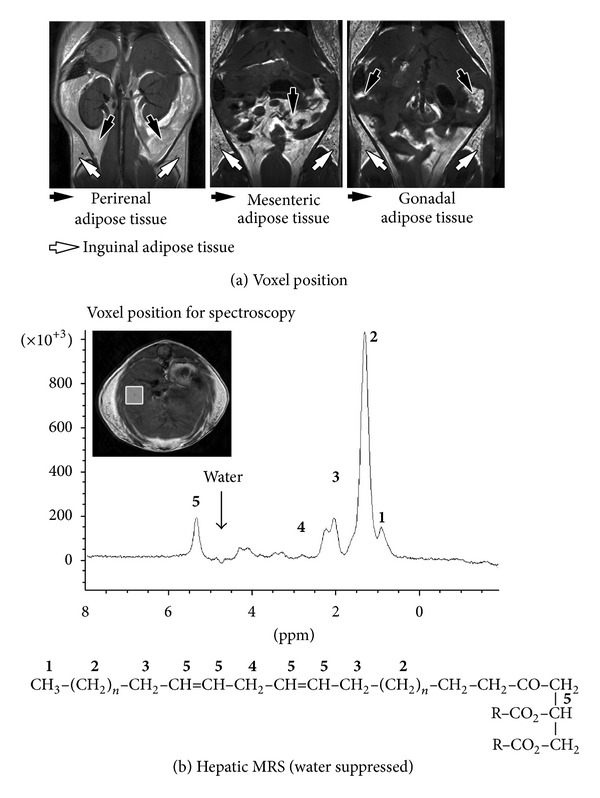
Figure 1.

Hepatic lipids composition. (a) Three coronal T1-weighted MR images displaying inguinal, perirenal, mesenteric, and gonadal adipose tissues. These images were used to perform volumetric analyses. (b) Axial T1-weighted liver image with the voxel position used for MRS analyses and an example of a water suppressed MRS spectrum. Each peak corresponds to a particular chemical group described as follows: 1 = terminal methyl (CH3) at 0.9 ppm; 2 = methylene groups of saturated fatty acids and the “saturated” components of mono- and poly fatty acids (CH2)n at 1.3 ppm; 3 = allylic as the methylene adjacent to methene groups (CH2) at 2.1 ppm; 4 = diallylic as the methylene inserted between sequential methene groups of fatty acid (CH–CH2–CH) at 2.8 ppm; 5 = methene as the olefinic groups (CH=CH) at 5.3 ppm.
