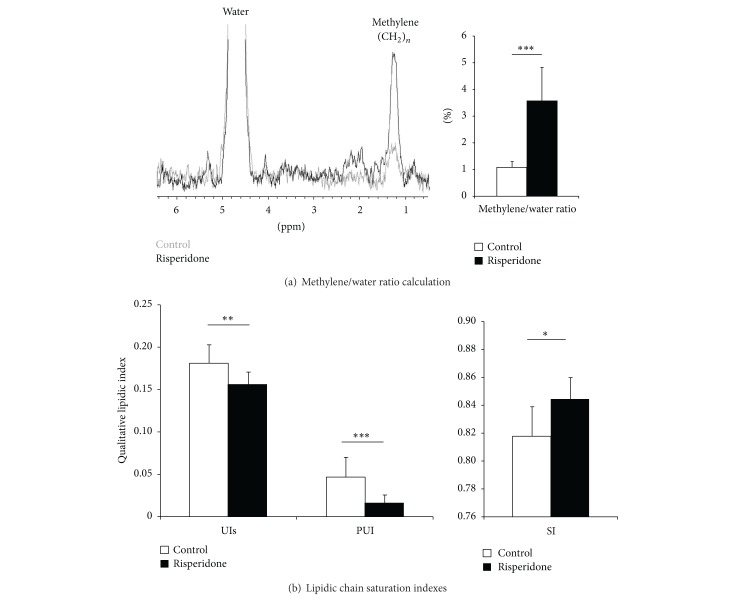
Figure 4.
Quantitative and qualitative in vivo lipid assessments. (a) Representative of water suppressed MR liver spectra (left; control: grey spectrum; risperidone: black spectrum). Spectra resulted from a voxel analysis positioned in liver as described in Figure 1(b). Water and methylene peaks were clearly visible and enabled the assessment of the methylene water ratio (MWR). MWR revealed that risperidone treatment increased the lipid accumulation in liver (right histogram: control (□) 1.10 ± 0.20% versus risperidone (■) 3.57 ± 1.26%; P < 0.001, n = 24). (b) Unsaturated Index surrogate (UIs), Poly Unsaturated Index (PUI), and Saturated Index (SI) reflecting the hepatic lipid composition. Compared to control mice, risperidone significantly induced an increase in UIs (control (□) 0.156 ± 0.016 versus risperidone (■) 0.182 ± 0.021; P < 0.01, n = 20), in SI (control (□) 0.844 ± 0.016 versus risperidone (■) 0.818 ± 0.021; P < 0.05, n = 20), and a decrease in PUI (control (□) 0.047 ± 0.023 versus risperidone (■) 0.017 ± 0.008; P < 0.001, n = 20).

