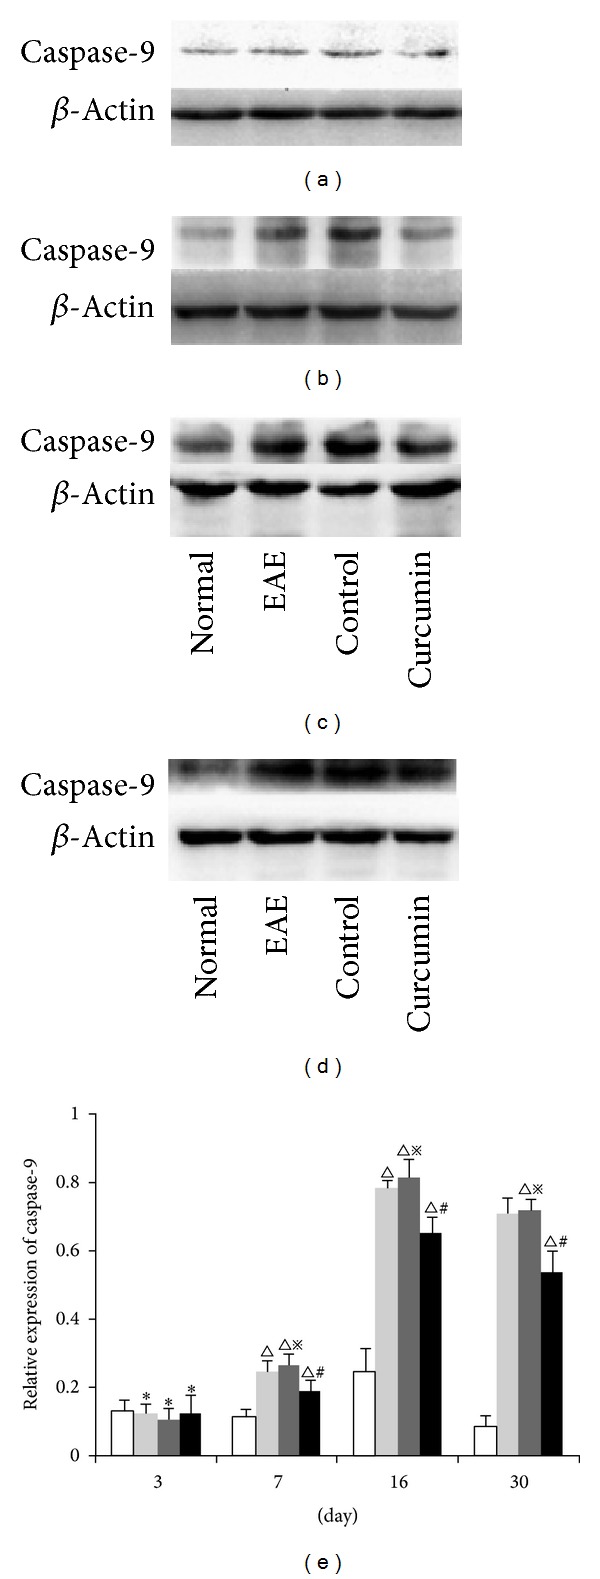
Figure 8.

Expression of cleaved caspase-9 in each group detected by western blot. (a) 3-day group, (b) 7-day group, (c) 16-day group, and (d) 30-day group. (e) Bars represent relative protein expression of cleaved caspase-9 related to β-actin. Data are presented as mean ± SD; *P > 0.05, compared to the normal group; △ P < 0.01, compared to the normal group; # P < 0.05, compared to the EAE group at the same time point; ※ P > 0.05, compared to the EAE group at the same time point.
