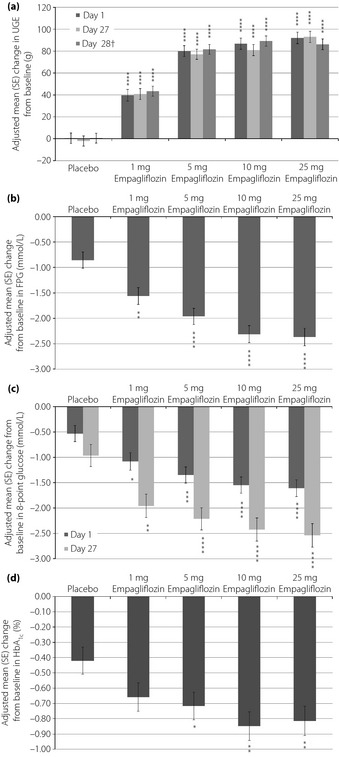
Figure 2.

Adjusted mean (standard error [SE]) changes from baseline in (a) cumulative urinary glucose excretion (UGE) after first (day 1) and multiple (days 27 and 28†) drug administration, (b) fasting plasma glucose (FPG) after multiple drug administration (day 28), (c) eight‐point glucose profile after first (day 1) and multiple drug administration (day 27) and (d) glycated hemoglobin (HbA1c) after multiple drug administration (day 28). †A meal tolerance test was carried out on day 28. *P < 0.05, **P < 0.01, ***P < 0.001, ****P < 0.0001 vs placebo.
