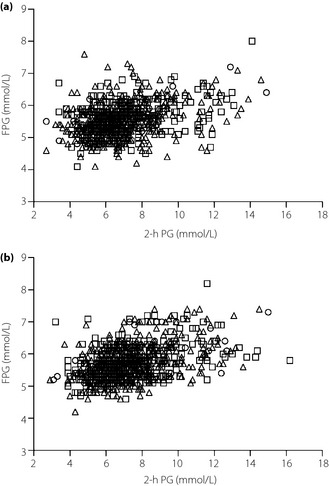
Figure 1.

Fasting plasma glucose (FPG) levels and 2‐h plasma glucose (PG) levels at the end of follow up among men. (a) Men with low body mass index (BMI). (b) Men with high BMI. The circles show group 1, the squares show group 2 and the triangles show group 3.
