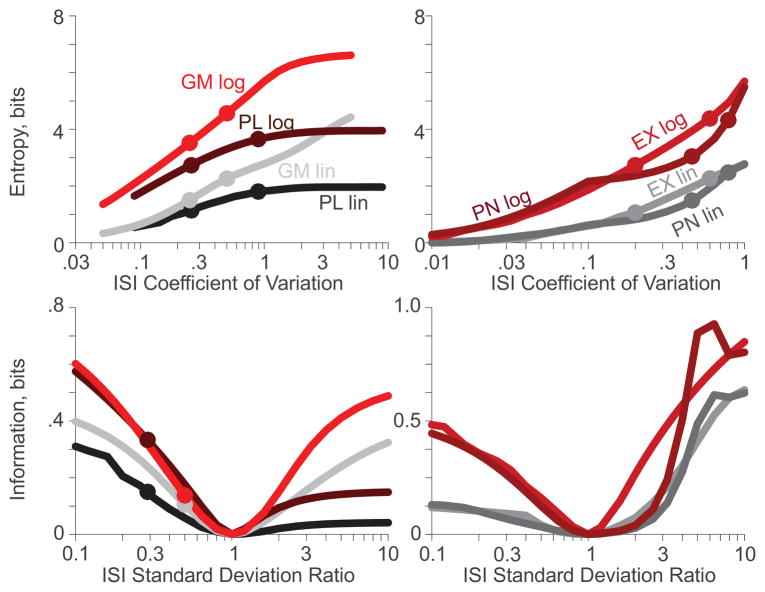
Figure 5.
Entropy (top) and information (bottom) calculations as a function of ISI CV for the the linear (grey-black) and logarithmic (red-brown) PDFs discretized into 100 bins each. Markers denote the parameterizations from Table 3 (a) and (c). (a). Entropies from the logarithmic PDFs are always larger than from the corresponding linear PDFs; (b). More information can be recovered from the logarithmic PDFs than from the linear PDFs for nearly all distributions at all ratios of ISI standard deviation (a.k.a., all ratios of CV).

