Figure 2.

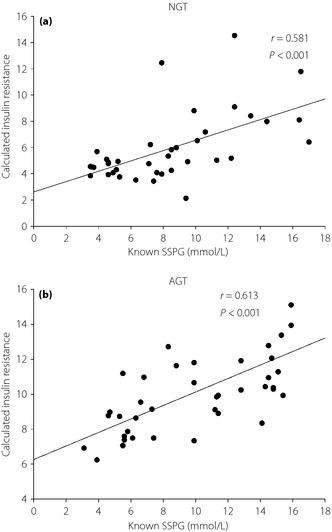
The linear relationship between calculated insulin resistance from model 5 and steady‐state plasma glucose (SSPG) in (a) the normal glucose tolerance group (NGT) and (b) the abnormal glucose tolerance group (AGT).

The linear relationship between calculated insulin resistance from model 5 and steady‐state plasma glucose (SSPG) in (a) the normal glucose tolerance group (NGT) and (b) the abnormal glucose tolerance group (AGT).