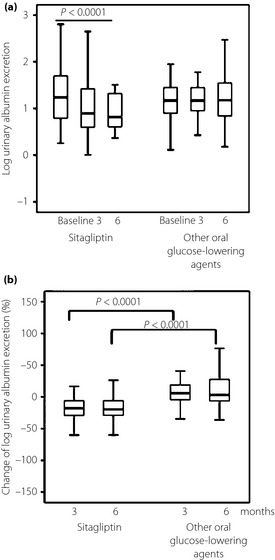
Figure 1.

(a) Comparison of the effects of sitagliptin and other oral glucose‐lowering agents administered for 3 and 6 months on log urinary albumin excretion. In these box‐and‐whisker plots, lines within the boxes represent median values; the upper and lower lines of the boxes represent the 25th and 75th percentiles, respectively; and the upper and lower bars outside the boxes represent the 90th and 10th percentiles, respectively. Baseline and post‐treatment values within each group were compared by Friedman test. (b) Mean percentage change in log urinary albumin excretion. Between‐group comparisons were tested by unpaired Mann–Whitney U‐test.
