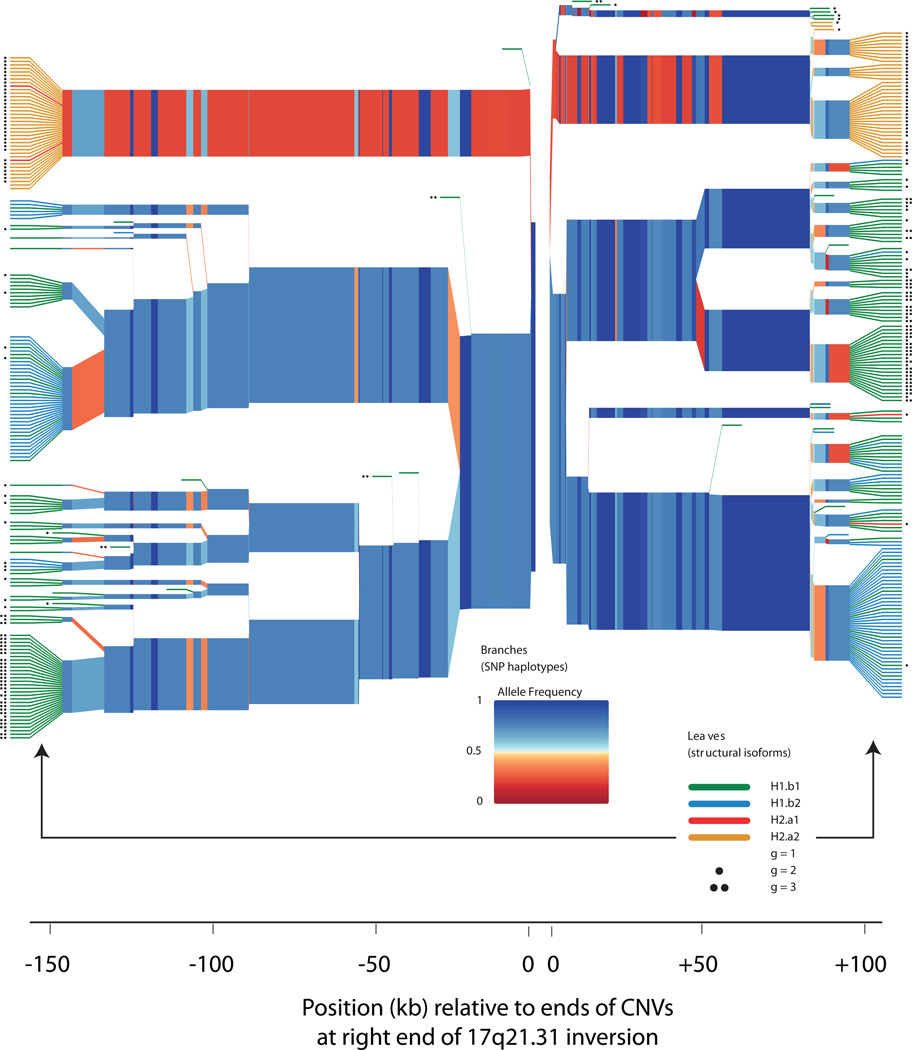
Figure 3.
Structural forms of 17q21.31 segregate on specific SNP haplotype backgrounds. The plot shows homozygosity and divergence (due to mutation and recombination) of the SNP haplotypes on which each structural form segregates in the European (CEU) trios analyzed in HapMap phase 3. The polymorphic CNV copies at the right end of the 17q21.31 inversion (Fig. 2) reside between the two origins of this plot (at center). SNPs on the left half of the plot therefore reside within the unique inverted region of 17q21.31, while SNPs on the right half of the plot are distal to the 17q21.31 inversion. On the branches, each colored segment represents the state of a SNP, with color representing allele frequency; branch points represent markers at which the depicted haplotypes diverge due to mutation and/or recombination with other haplotypes. The colored leaves and dots indicate the structural forms associated with each SNP haplotype. (Red leaves, H2.α1; orange leaves, H2.α2; green leaves, H1.β1; blue leaves, H1.β2; black dots, extra copies of the γ duplication.) In the plot, the structures are represented on the leaves in order to clarify their relationships to SNP haplotypes, but the variable parts of these CNVs actually reside (in genomic space) within the gap at center between the two origins on the plot. The structural forms segregate on characteristic SNP haplotypes, both inside and outside the inversion region. Statistical imputation of structural alleles utilizes SNPs on both sides of the CNVs together with more-distant markers not shown here.

