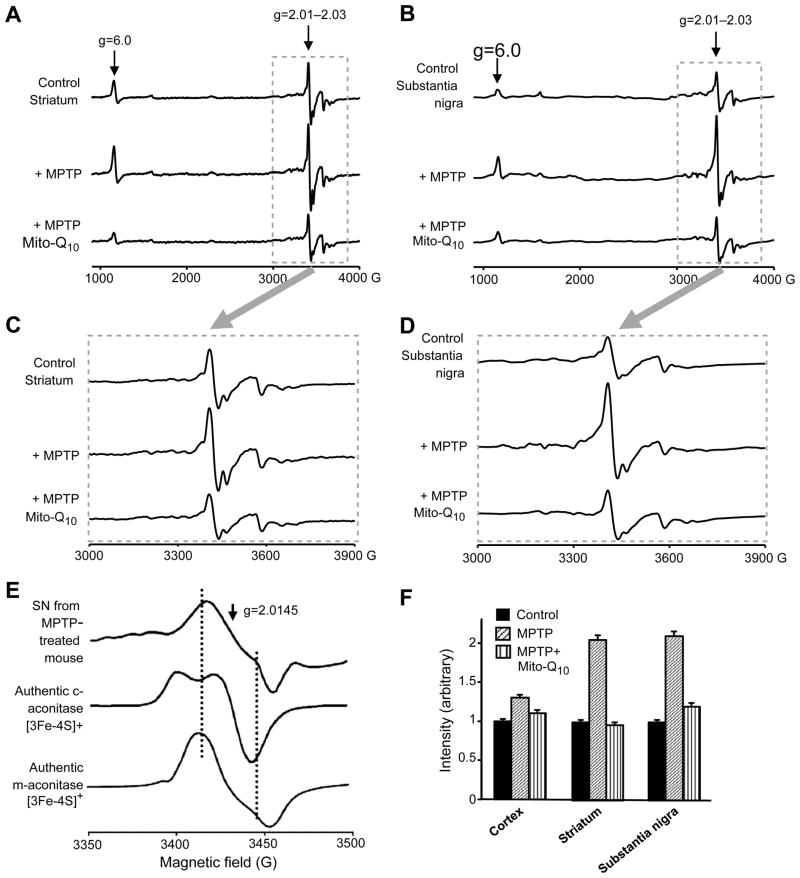
Fig. 8.
The low-temperature EPR spectra from mouse brain tissues. (A) EPR spectra were obtained at 10–15 K from striatal tissues isolated from MPTP- and MPTP plus Mito-Q10-treated mice. (B) Same as (A), except that tissues were isolated from the substantia nigra of mice. (C) Expansion of the region inside the box shown in (A). (D) Expansion of the region inside the box shown in (B). (E) EPR spectra of authentic [3Fe–4 S]+ generated from cytosolic and mitochondrial aconitases. For the sake of comparison, the expanded spectrum at the region g=2.01–2.03 obtained from the SN tissues isolated from MPTP-treated mice is included. (F) Bar graphs showing the spectral intensities of the signal obtained at g=2.01–2.03 from tissues isolated from the various regions of the brain from mice treated with MPTP and MPTP plus Mito-Q10. Spectra were recorded at 10 K.

