FIGURE 2.
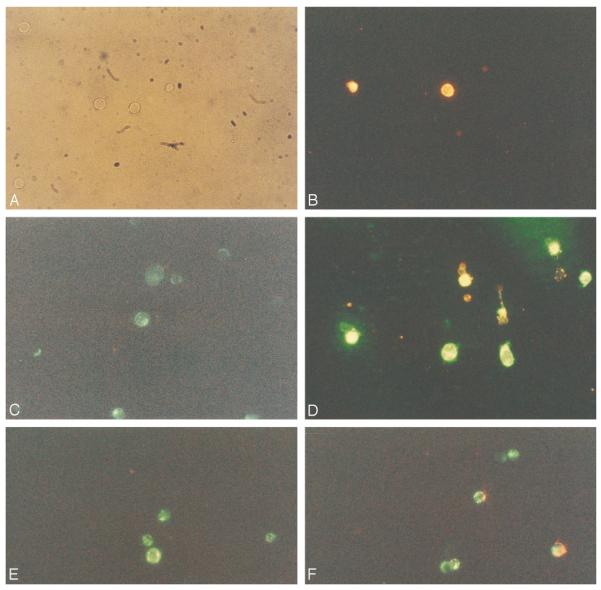
Fluorescence microscopy of control (A, C, and E) and Fas-treated Jurkat cells (B, D, and F) stained with potentiometric dyes DiOC6 and JC-1. Jurkat cells were cultured for 1 h in the absence (control) or the presence of 50 ng/ml Fas Ab CH-11. A and B were stained with annexin V-PE. In A, in the absence of fluorescence, cells illuminated with visible light are shown. C and D were stained with annexin V-PE (red) and DiOC6 (green). C shows green fluorescence only. D shows increased green (DiOC6) fluorescence of annexin V-negative cells; bright yellow cells show concurrent DiOC6 and annexin V-PE staining; shrunken cells with red annexin V-PE staining displayed diminished green (DiOC6) fluorescence. E and F were stained with JC-1. Green fluorescence was detected in control cells (E), while green and red fluorescence was noted in Fas-stimulated cell populations (F). Magnifications, ×400.

