Figure 1.

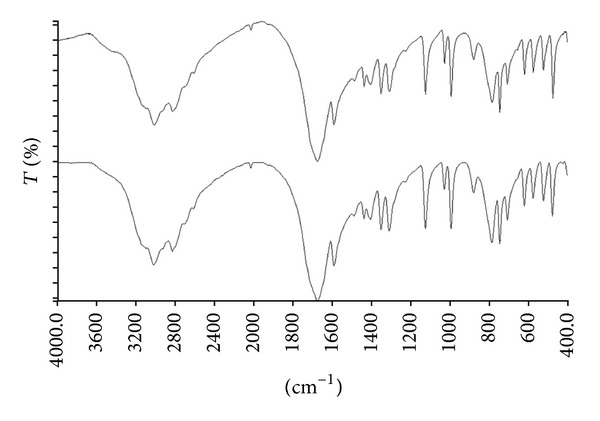
FT-IR spectrum of a uric acid anhydrous stone (top) matched with reference spectra contained in the NICODOM library. The reference spectrum of uric acid anhydrous stone with the best fit value was showed in the bottom.

FT-IR spectrum of a uric acid anhydrous stone (top) matched with reference spectra contained in the NICODOM library. The reference spectrum of uric acid anhydrous stone with the best fit value was showed in the bottom.