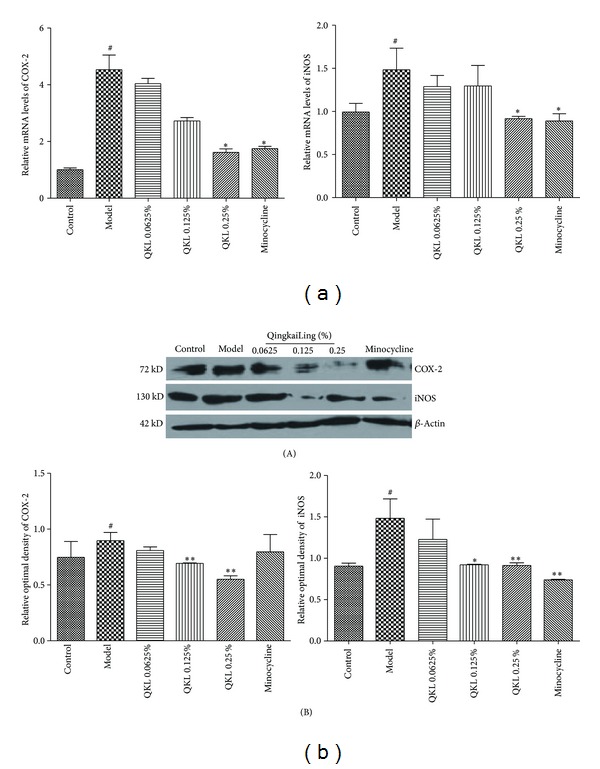
Figure 4.

Hypoxia/reoxygenation-induced changes in the protein and mRNA expression levels of COX-2 and iNOS; β-actin was also quantified as a control. (a) The mRNA expression levels of COX-2 and iNOS were determined via real-time PCR. (b) The cellular protein expression levels of COX-2 and iNOS were analyzed via Western blot. # P < 0.01 compared to the control group; *P < 0.05 and **P < 0.01 compared to the model group.
