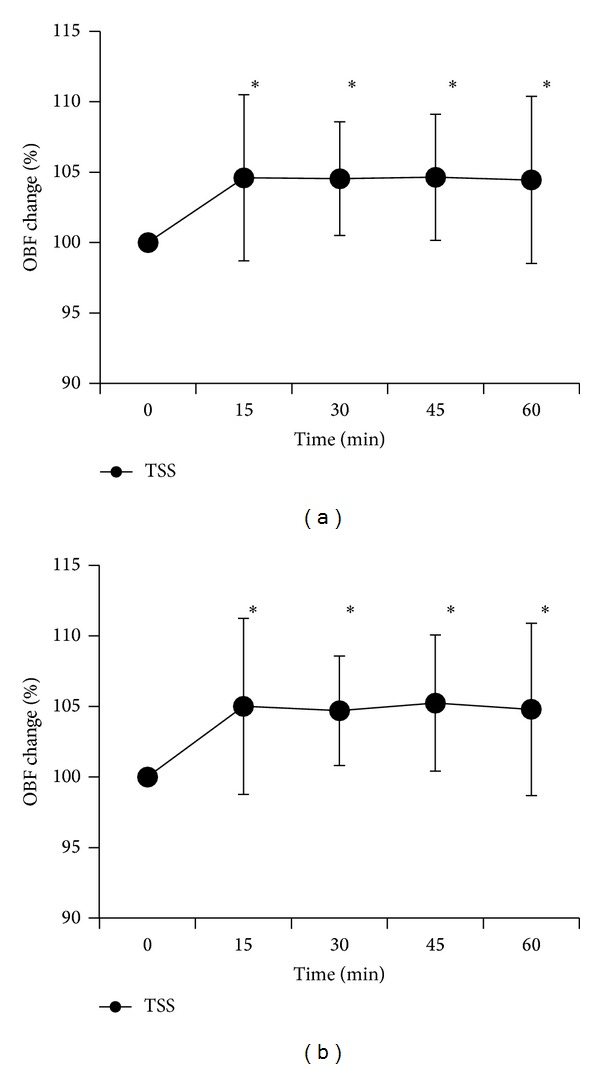
Figure 2.

Dynamic OBF changes in subjects with blood deficiency and blood stasis (a) and with blood deficiency and fluid retention (b) in response to administration of TSS. Data are expressed as mean ± standard deviation. The asterisk indicates a statistically significant difference from the baseline (repeated measurements of ANOVA, with post hoc Dunnett's test).
