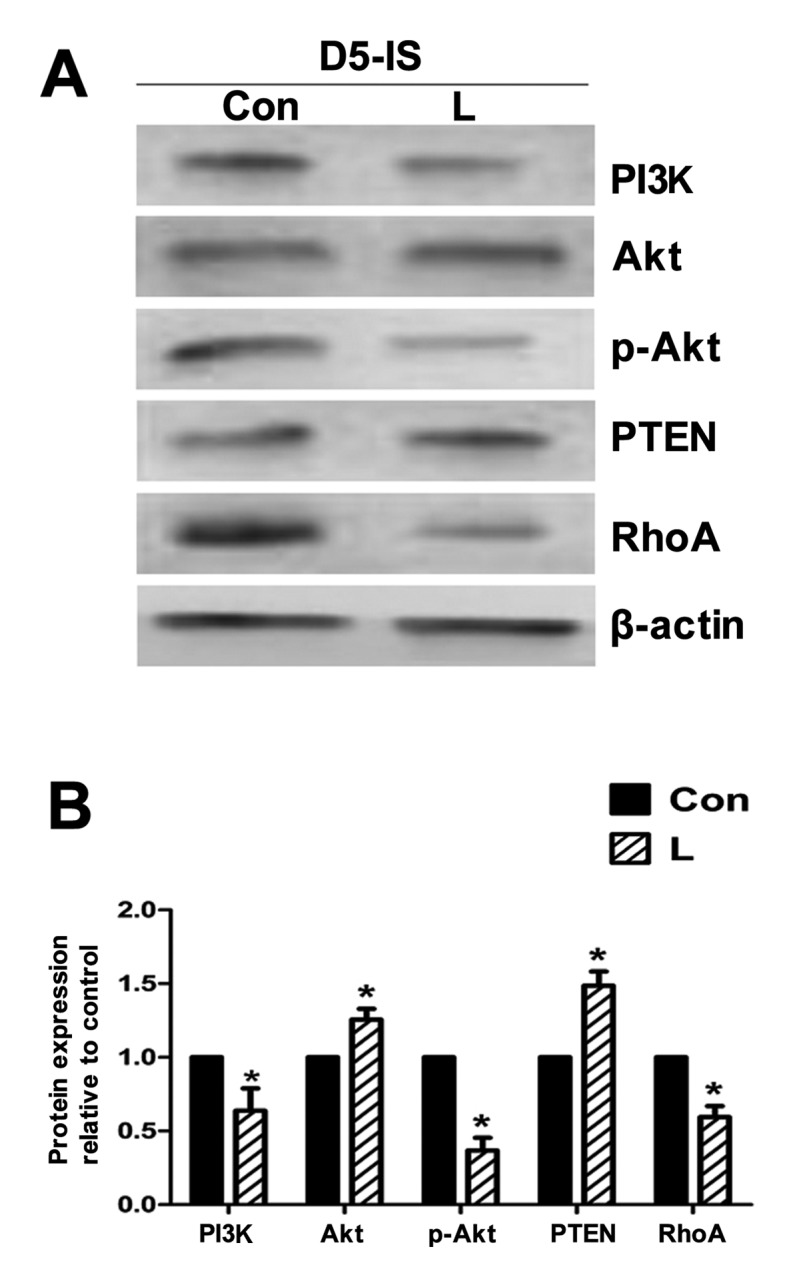
Figure 7.

Western blot analysis of the expression of PI3K, Akt, p-Akt, PTEN and RhoA in the inhibitor group injected with LY294002 (L) and the control group (Con; not injected). β-actin was used as the internal control. (A) Western blot analysis electrophoresis graph. (B) Relative densitometric analysis of these proteins between the inhibitor group and the control group. The experiment was performed 3 times. Three mice were used in each experiment. *P<0.05 indicates statistical significance between the inhibitor group and the control group at pregnancy day 5.
