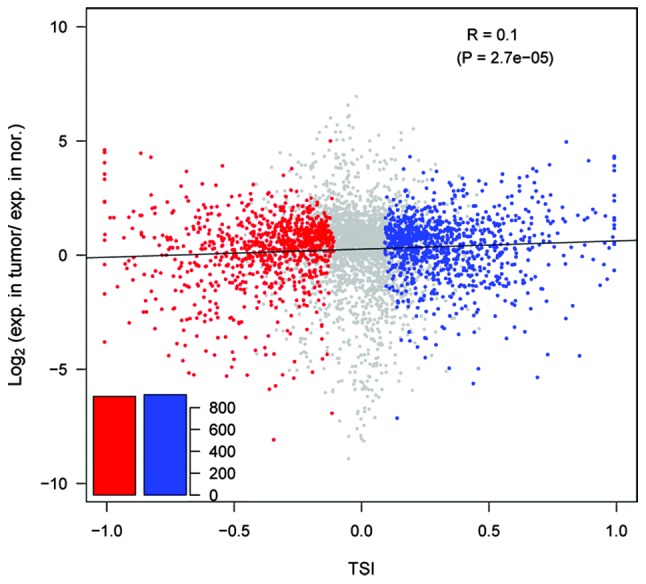
Figure 3.

APA site switching and gene expression in normal and cancerous tissue. TSI values are plotted against the Log2 of the expression level of genes from the cancerous tissues relative to normal tissues. Larger TSI values indicate that longer tandem UTRs are present in carcinoma tissues. Genes with significant switching to longer (blue) or shorter (red) tandem UTRs in cancerous tissues are colored (false discovery rate<0.01). Nor, normal tissue; Exp, expression; TSI, tandem APA site switch index; UTR, untranslated region. APA, alternative polyadenylation.
