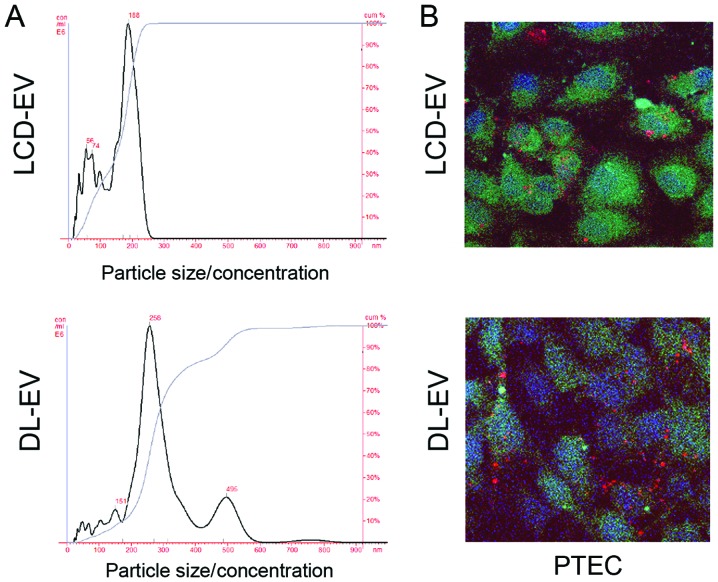
Figure 3.
Size analysis and incorporation by renal tubular epithelial cells. (A) Representative cell-derived extracellular vesicle (EV) sizes analyzed by measurement with NanoSight. Three different preparation were analyzed with similar results. LCD-EVs maintain the same size distribution than the non-labeled EVs (180±73 nm). DL-EVs show a size of 250±89 nm with a second larger peak. (B) Representative micrographs of EV incorporation (5 h at 37ºC) in renal proximal tubular epithelial cells (PTECs). The EVs (red) produced with the two labeling procedures are equally incorporated by PTEC cells (green). Three experiments were performed with similar results. Nuclei were counterstained with DAPI (blue). Original magnification, ×630. LCD-EV, labeled EVs produced by donor cells; DL-EV, directly labeled EVs.

