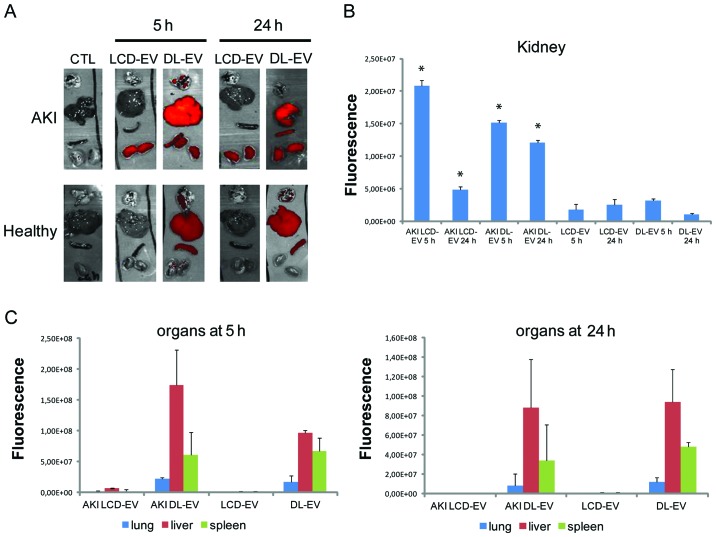
Figure 6.
Ex vivo optical imaging (OI) analysis of dissected organs. (A) Representative OI images of dissected organs of mice with acute kidney injury (AKI) and healthy mice treated with LCD- and DL-EVs sacrificed at 5 and 24 h after injection. (B) Fluorescence quantification of kidneys, expressed as the average radiance ± standard deviation (SD). ANOVA with Newman-Keuls multi-comparison test was performed. *p<0.05 AKI EVs vs. healthy EVs. (C) Fluorescence quantification, expressed as the average radiance ± SD, of lungs, liver and spleen. AKI mice treated with LCD-EVs sacrificed at 5 h (n=9) and at 24 h (n=7); AKI mice treated with DL-EVs sacrificed at 5 h (n=6) and at 24 h (n=5); healthy mice treated with LCD-EVs sacrificed at 5 h (n=6) and at 24 h (n=6); healthy mice treated with DL-EVs sacrificed at 5 h (n=3) and at 24 h (n=3). LCD-EV, labeled EVs produced by donor cells; DL-EV, directly labeled EVs.

