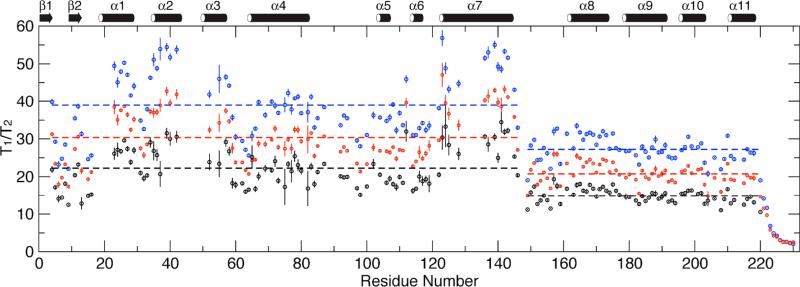
Figure 2.
The measured (for clarity only the 0.4 mM and 0.2 mM datasets are shown in blue and red, respectively) and the extrapolated (“0” mM, black) backbone 15N spin relaxation time ratios T1/T2. The dashed lines mark the average <T1/T2> for each domain in each measurement and end at domain boundaries.

