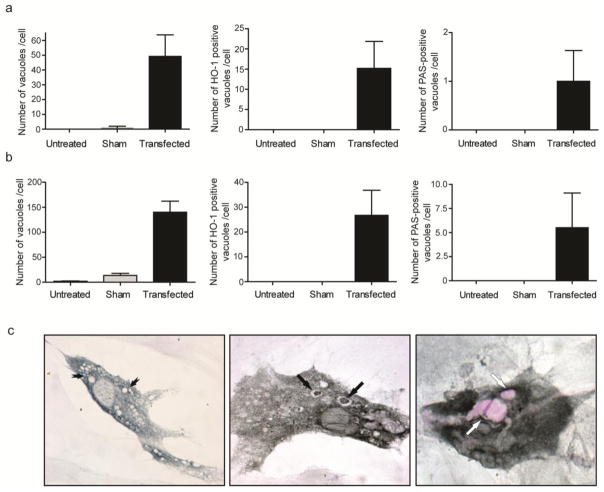
Fig. 4. Quantification of PAS-positive cytoplasmic inclusions and PAS-negative vacuoles in HMOX1-transfected and control rat astrocytes.
CA-like structures were identified on morphological grounds (panel c) and quantified as total vacuoles (tailed arrows), vacuoles containing or surrounded by Flag-HO-1-immunoreactive material (black arrows), and PAS-positive inclusions (white arrows). Calculations were expressed as number of vacuoles per cell at day 2 (panel a) and day 3 (panel b) post-transfection. N = 4–5 glial monolayers per group from several independent cultures.

