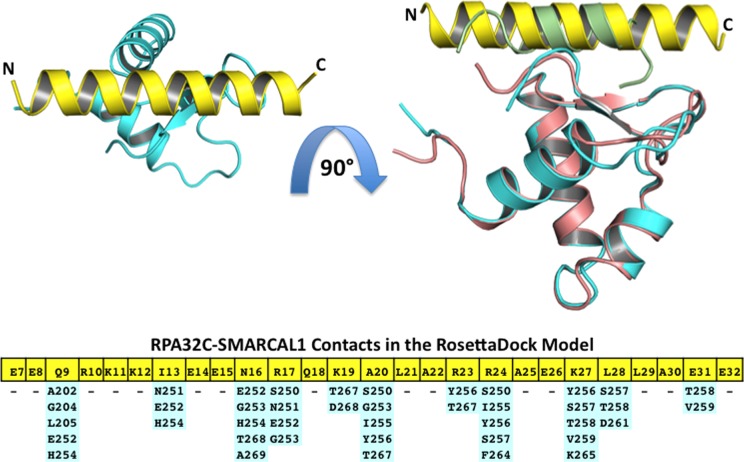
Figure 10.
Model of the RPA32C–SMARCAL1-RBM complex. The top left panel shows a ribbon representation of the RosettaDock model of RPA32C (cyan) in complex with the SMARCAL1-RMB peptide (yellow). The top right panel shows an overlay of the structure shown in the top left panel with the complex of RPA32C (salmon) in complex with the UNG2 peptide (green). The orientation is shifted by 90° with respect to the top[ left panel. The bottom panel lists contacts between SMARCAL1-RBM residues (yellow) and residues in RPA32C (cyan). Contacts were assigned using Contacts of Structural Units analysis.46

