
Figure 5.
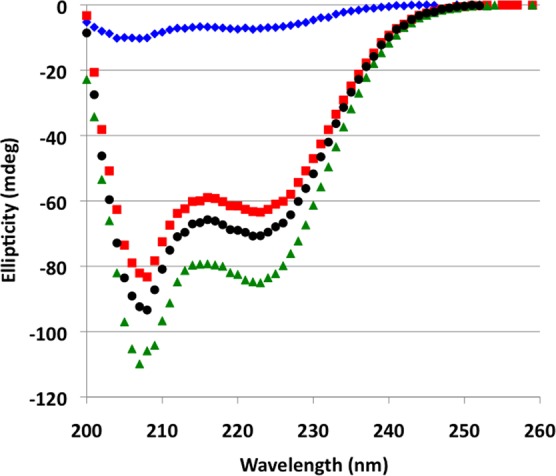
CD spectra of RPA32C, SMARCAL11–32, and the RPA32C–SMARCAL11–32 complex. CD spectra acquired at 25 °C for SMARCAL11–32 alone (blue diamonds), RPA32C alone (red squares), and the SMARCAL11–32–RPA32C complex (green triangles). The sum of the spectra for RPA32C and SMARCAL11–32 is shown with black circles.