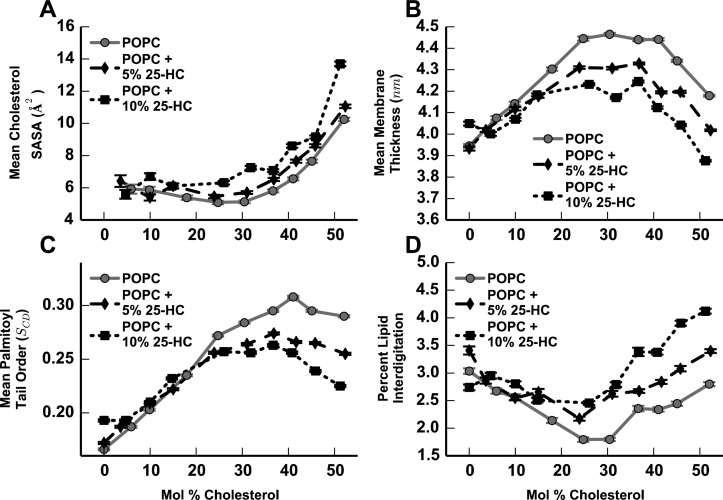
Figure 2.
Analysis of membrane properties calculated from simulated membrane bilayers composed of 5% 25-HC in POPC (−–−) and 10% 25-HC in POPC (···) with varying concentrations of cholesterol, compared with data from previously published control simulations lacking 25-HC18 (solid gray lines). (A) Mean cholesterol solvent-accessible surface area. (B) Mean membrane thickness. (C) Mean phospholipid tail order. (D) Percent lipid interdigitation.

