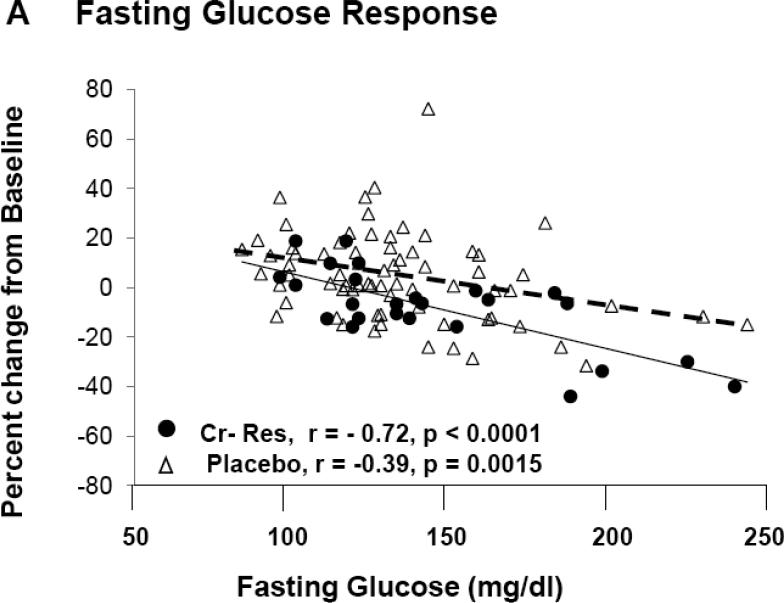
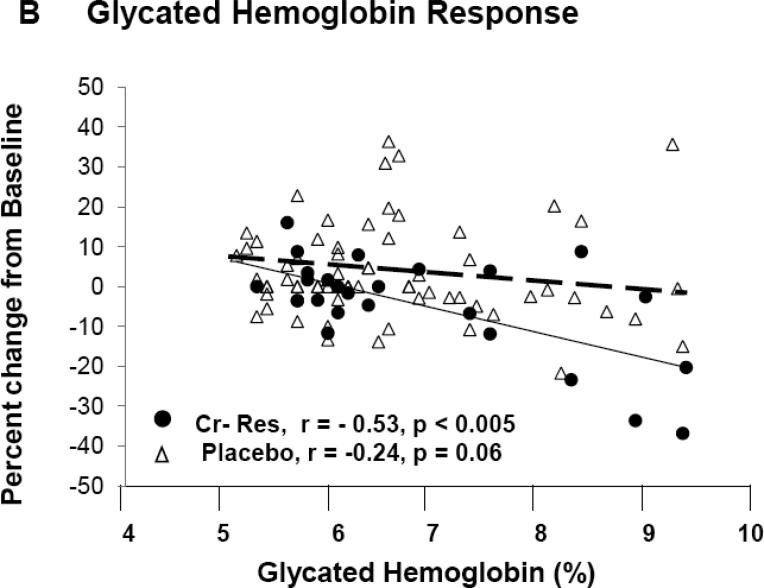
Figure 3.
Demonstrates the percentage change for fasting glucose (3A) and glycated hemoglobin (3B) when plotted versus the individual baseline value for “responders” and placebo groups. There was no correlation for % change in fasting glucose (r = 0.07, p = ns) nor glycated hemoglobin (r = 0.05, p = ns) for “non-responders” (Data not shown).


