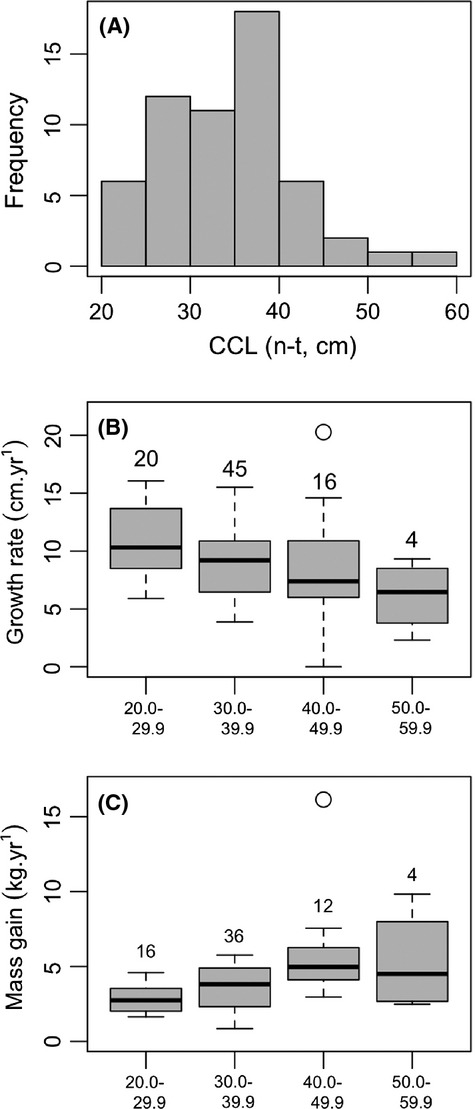
Figure 2.

Plots showing (A) frequency histogram of carapace length (CCL, n-t) for all hawksbill turtles on initial capture, boxplots of (B) growth rate and (C) mass gain of juvenile hawksbill turtles in Anegada, showing rates for four size classes of turtles at first capture (in centimeters), n individuals noted above each boxplot. Gray box shows interquartile range, solid black line shows median value. Circles show statistical outlier value. Growth rates decreases significantly with body size, while mass gain increases.
