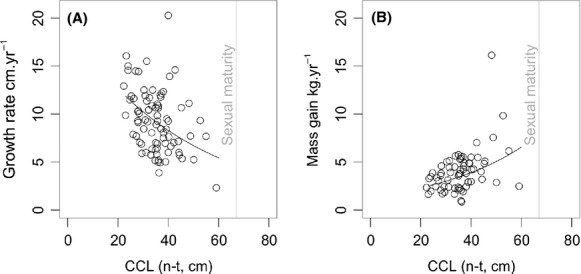
Figure 4.

Plots showing fitted model (black line) and raw data (open circles) of (A) growth rate and (B) mass gain as a function of carapace length at first capture. Dashed gray vertical line shows approximate size at sexual maturity for hawksbill turtles (67 cm; (Meylan et al. 2011)).
