
Figure 3.
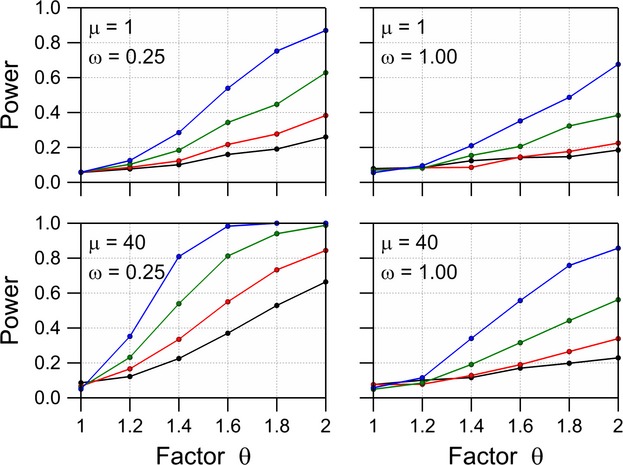
Power of a likelihood ratio difference test with α = 0.05 for the negative binomial distribution with dispersion parameter ω, a mean μ for the comparator and a mean θμ for the GM plant for replication levels N = 6 (black), 10 (red), 20 (green), and 40 (blue).