
Figure 4.
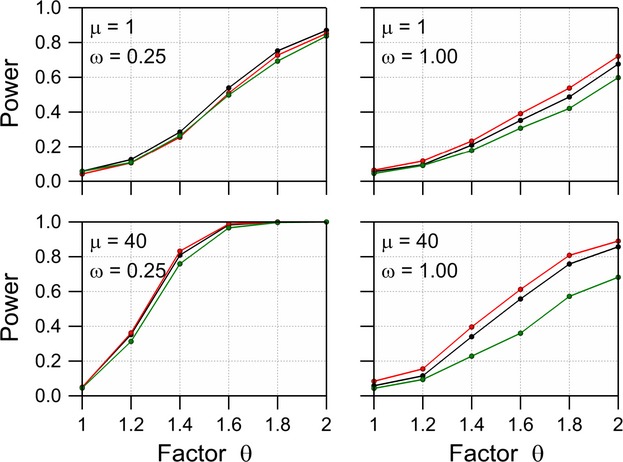
Power of a likelihood ratio difference test with α = 0.05 for negative binomial data with dispersion parameter ω, a mean μ for the comparator, and a mean θμ for the GM plant for replication level N = 40 when analyzed employing a negative binomial model (black), a quasi-Poisson model (red), and a log transformation (green).