
Figure 5.
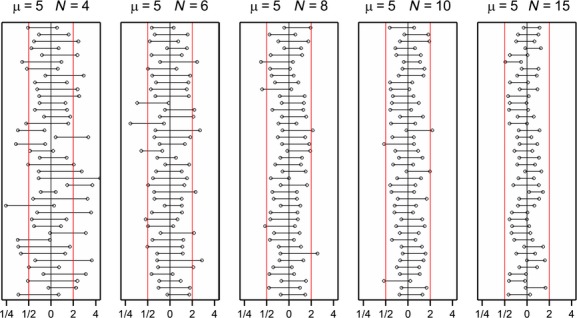
95% likelihood ratio confidence intervals for the ratio of the Poisson means of the GM plant and the comparator when the underlying mean of both is μ = 5 and various numbers of replication N. The red vertical lines denote the artificial equivalence limits set at 1/2 and 2.