
Figure 6.
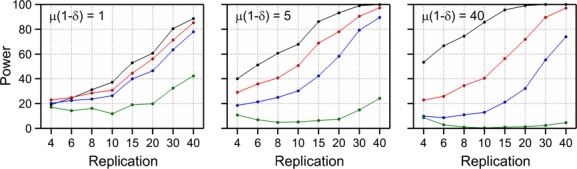
Power of a likelihood ratio difference test with α = 0.05 for negative binomial data with overdispersion parameter ω = 0.25 and additional excess-zeros with probability δ = 0 (black), 0.1 (red), 0.2 (blue), and 0.5 (green). The comparator has mean μ(1 −δ), and the GM plant has a mean of 2μ(1 − δ).