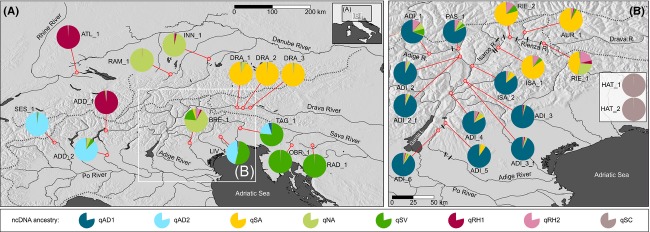
Figure 2.

(A) Spatial distribution of test (Adriatic Drainage, except Adige Basin) and reference samples (Danube and Rhine basins) and (B) details of sampling sites within the Adige Basin. The two reference hatchery samples were collected from Italian fish farms within the Adige Basin. STRUCTURE-based mean admixture proportions at each sampling site are presented as pie charts. Impassable barriers to migration are shown in (B) as small black dash. Detailed information of sampling sites is given in Table 1.
