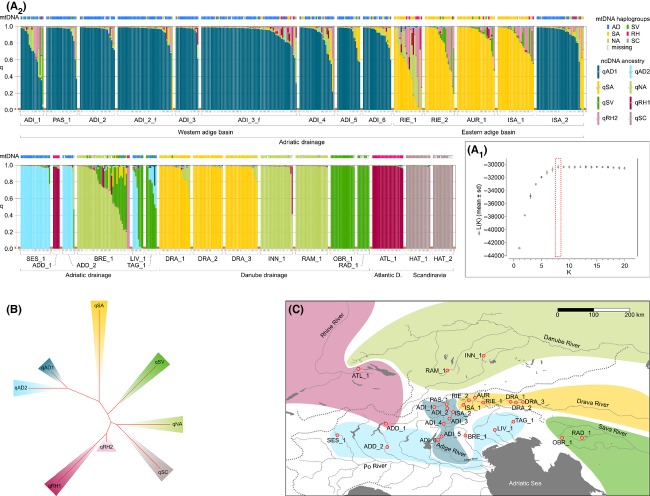
Figure 3.
(A1) Mean of the estimated ln probability of data (±SD) for the different tested number of STRUCTURE genetic clusters (K). (A2) Population structure of test (first block) and reference samples (second block), ordered by drainage basins and respective subdrainages. Each vertical bar represents a fish and its proportional membership to one of the eight genetic clusters identified by STRUCTURE. In addition, mtDNA haplogroup membership is presented for each individual. Sample codes according to Table 1. (B) Neighbor-Joining tree representing the distance among clusters, based on the net nucleotide distances output by STRUCTURE. (C) A schematic representation of the geographic distribution of the genetic clusters identified by STRUCTURE (qRH2 is missing because it was under-represented in the test-samples and completely absent in the reference-samples).

