
Figure 5.
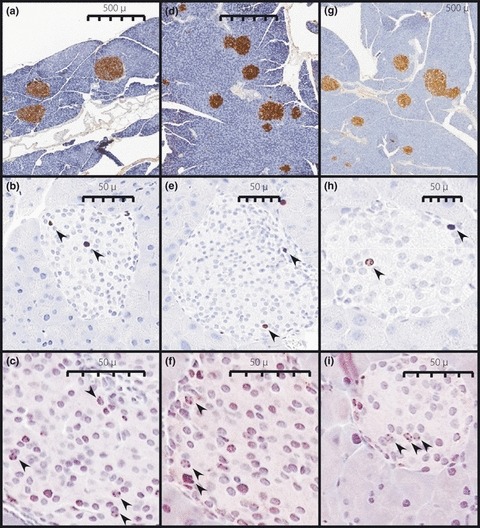
Representative insulin (a, d, g), Ki67 (b, e, h) and activated caspase‐3 (c, f, g) immunostaining. Arrows indicate positively stained nuclei. Images are from MM (a–c), WW (d–f), and GW (g–i) mice maintained on high fat diet for 12 months.
Official websites use .gov
A
.gov website belongs to an official
government organization in the United States.
Secure .gov websites use HTTPS
A lock (
) or https:// means you've safely
connected to the .gov website. Share sensitive
information only on official, secure websites.
Representative insulin (a, d, g), Ki67 (b, e, h) and activated caspase‐3 (c, f, g) immunostaining. Arrows indicate positively stained nuclei. Images are from MM (a–c), WW (d–f), and GW (g–i) mice maintained on high fat diet for 12 months.