Figure 3.

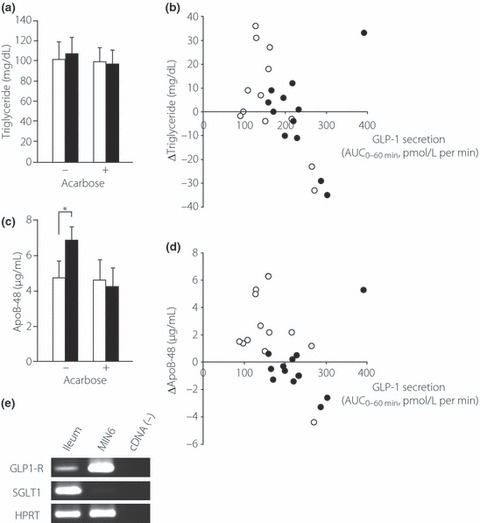
Postprandial (a,b) triglyceride and (c,d) apolipoprotein (Apo) B‐48 levels in the blood and (e) mRNA expression of the glucagon‐like peptide (GLP)‐1 receptor (GLP‐1R) in mouse ileal mucosa. (a,c) Serum triglyceride (a) and ApoB‐48 (c) concentrations, with or without acarbose pretreatment, as indicated. (□), values at 0 min; ( ), values at 120 min after the meal. (b,d) Relationship between GLP‐1 secretion and increases in serum triglyceride (b) or ApoB‐48 (d). GLP‐1 secretion is expressed as AUC0–60min of plasma intact GLP‐1 levels, whereas increases in serum triglyceride or ApoB‐48 are expressed as change at 120 min after meal. Symbols represent data from individuals without (○) or with (•) acarbose pretreatment. Data are the mean ± SE. *P < 0.05. (e) mRNA expression of GLP‐1R in mouse ileal mucosa as determined by RT‐PCR. Data are shown for GLP‐1R, sodium–glucose cotransporter 1 (SGLT1), and hypoxanthine guanine phosphoribosyl transferase (HPRT) in mouse ileal mucosa and MIN6 cells.
