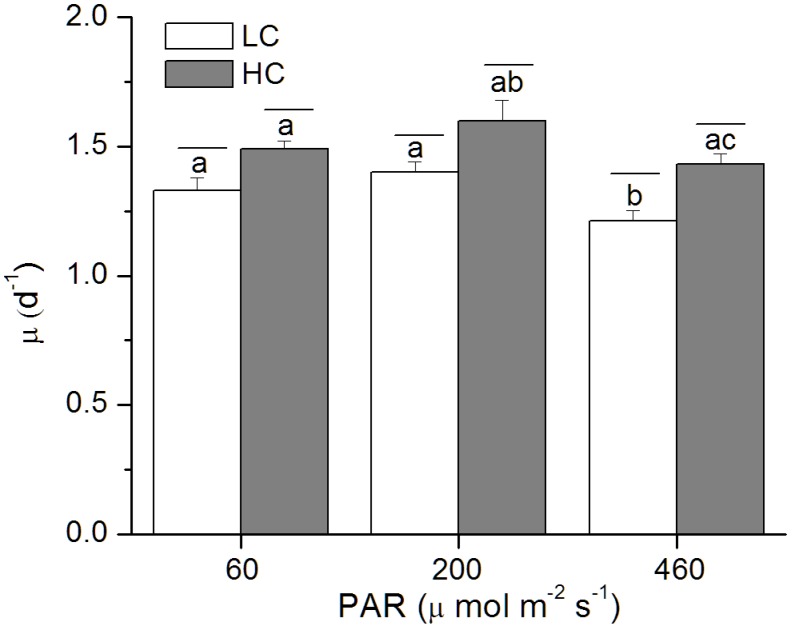
Figure 1. Specific growth rates of P. tricornutum.
Growth rates of P. tricornutum cells grown under the LC (390 ppmv, pH 8.18) and HC (1000 ppmv, pH 7.82) and then both acclimated to different light levels (60, 200 and 460 µmol m−2 s−1) for 25–36 generations. Values are means ± SD, n = 3. The short-lines above the histogram bars indicate significant difference between LC and HC, and the different letters indicate significant differences among the light treatments within the HC- or LC-grown cells at p<0.05.

