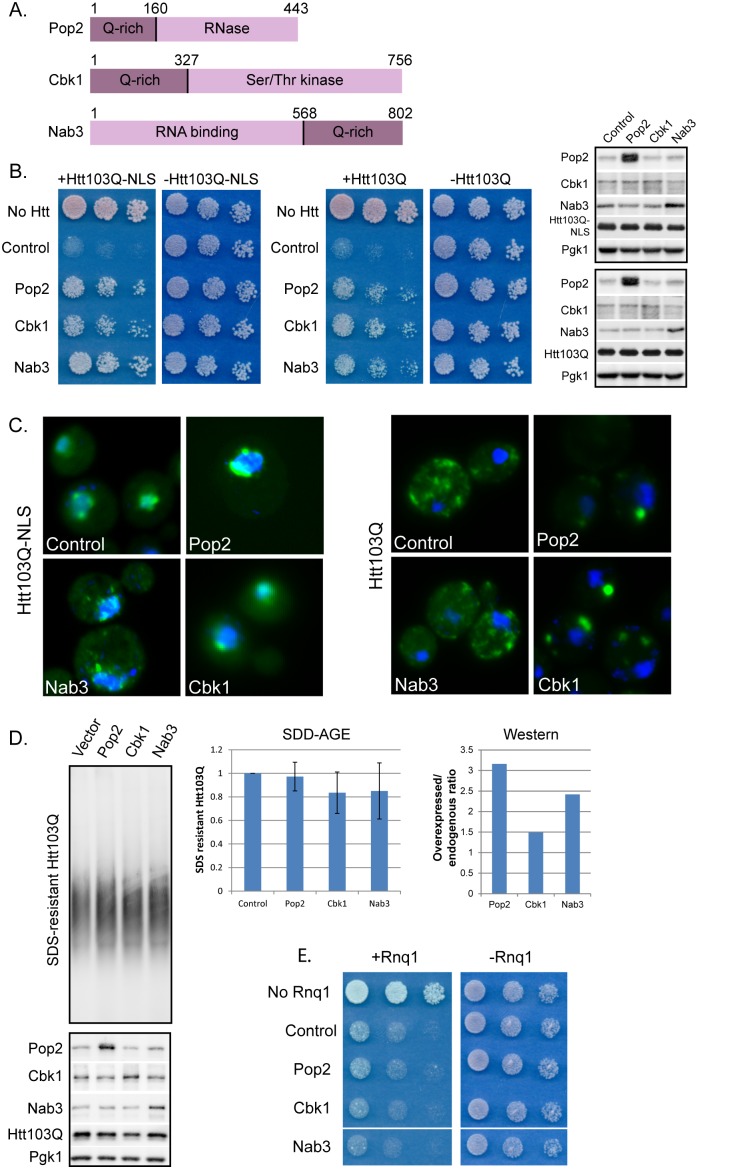
Figure 2. PolyQ-rich proteins suppress Htt103Q-NLS and Htt103Q toxicity.
(A) Diagram of polyQ-rich screen hits. Numbers represent amino acids. N- or C-terminal polyQ-rich regions and functional domains are indicated. Further information is given in . (B) Pop2, Cbk1, and Nab3 suppress growth defect associated with Htt103Q-NLS and Htt103Q. Growth assays were plated in 5-fold dilutions on glucose (−Htt) or galactose (+Htt). Western blot indicates Htt expression levels at 4 h galactose induction with indicated proteins co-expressed. (C) Pop2 and Cbk1 but not Nab3 alter Htt103Q-NLS and Htt103Q aggregation as monitored by fluorescence microscopy. Nuclei were visualized with DAPI staining. (D) Pop2, Cbk1, and Nab3 do not alter SDS-resistant Htt103Q aggregation as monitored by SDD-AGE and Western blot analysis. Graphs indicate quantitation of SDS-resistant Htt103Q (N = 3, SE indicated) and ratio of overexpressed Pop2, Cbk1, or Nab3 over endogenous. (E)Toxicity associated with Rnq1 over-expression is unaffected by screen hits. Growth assays were plated in 5-fold dilutions on glucose (−Rnq1) or galactose (+Rnq1). Endogenous Rnq1 is present in a [RNQ+] prion state in this experiment. Pop2, Cbk1, and Nab3 were expressed from high copy plasmids under control of their endogenous promoters in each experiment. Htt103Q was induced with 2% galactose for 4 h.

