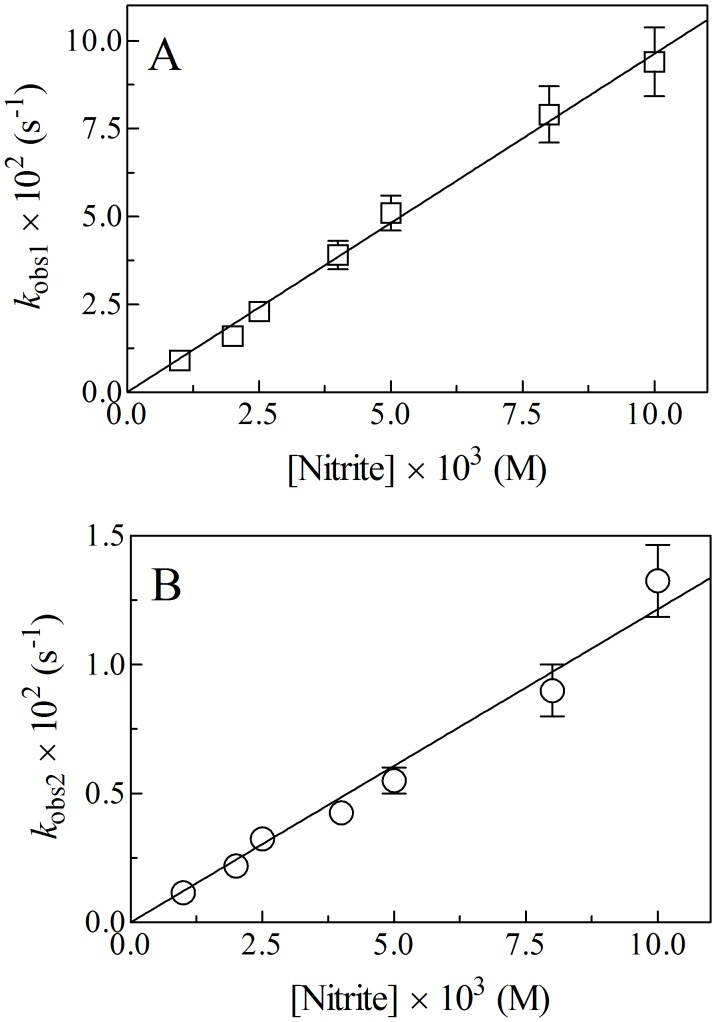
Figure 4. Dependence of k obs1 (panel A) and k obs2 (panel B) on the NO2 – concentration for the Ma-Pgb*-Fe(II) reductase activity, at pH 7.4 and 20°C.
The analysis of data according to Eqs 2 and 3 allowed the determination of the following values of k app1 = 9.6±0.2 M–1 s–1 and k app2 = 1.2±0.1 M–1 s–1. Where not shown, the standard deviation is smaller than the symbol. For details, see text.

